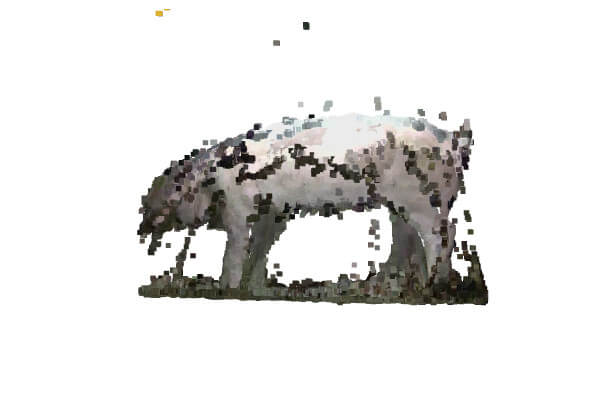
最近有家初创企业要求面试前机试,结果发了个ply(Polygen File Format)格式的文件,里面记录着生猪的点云图。其文件内容类似如下:
ply
format binary_little_endian 1.0
element vertex 626250
property float x
property float y
property float z
property uchar red
property uchar green
property uchar blue
end_header
要读取其数据主要有两种方式,一种是使用plyfile,另一种是使用open3d。首先来看第1种方式读取其数据:
>>> from plyfile import PlyData
>>> ply_data = PlyData.read("hog.ply")
>>> ply_data["vertex"]
PlyElement('vertex', (PlyProperty('x', 'float'), PlyProperty('y', 'float'), PlyProperty('z', 'float'), PlyProperty('red', 'uchar'), PlyProperty('green', 'uchar'), PlyProperty('blue', 'uchar')), count=626250, comments=[])
>>> ply_data["vertex"].data
memmap([(186.54663, -111.72368,  778.7497, 219, 230, 234),
        (185.23463, -115.89012,  780.1351, 209, 220, 224),
        (183.42976, -117.20565,  780.244 , 201, 212, 216), ...,
        (161.     ,  371.     , 1050.    ,  82,  84,  71),
        (162.     ,  371.     , 1050.    ,  80,  82,  69),
        (164.     ,  371.     , 1050.    ,  76,  75,  57)],
       dtype=[('x', '<f4'), ('y', '<f4'), ('z', '<f4'), ('red', 'u1'), ('green', 'u1'), ('blue', 'u1')])
>>> ply_data["vertex"].data["x"]
memmap([186.54663, 185.23463, 183.42976, ..., 161.     , 162.     ,
        164.     ], dtype=float32)
要获取其坐标值,需要进行如下的处理:
>>> import numpy as np
>>> vertices = np.vstack([ply['vertex']['x'], ply['vertex']['y'], ply['vertex']['z']]).T
通过使用numpy的vstack将3个向量拼接在一起,从而组成3x626250向量,再经过转置从而得到626250x3向量。
而第2种方式的代码如下:
>>> import open3d as o3d
>>> pcd = o3d.io.read_point_cloud("hog.ply")
>>> o3d.visualization.draw_geometries([pcd])
上述代码将实现点云的可视化。若要获取其对应的点,则可以使用如下的代码:
>>> points=np.asarray(pcd.points)
其结果如下图所示:
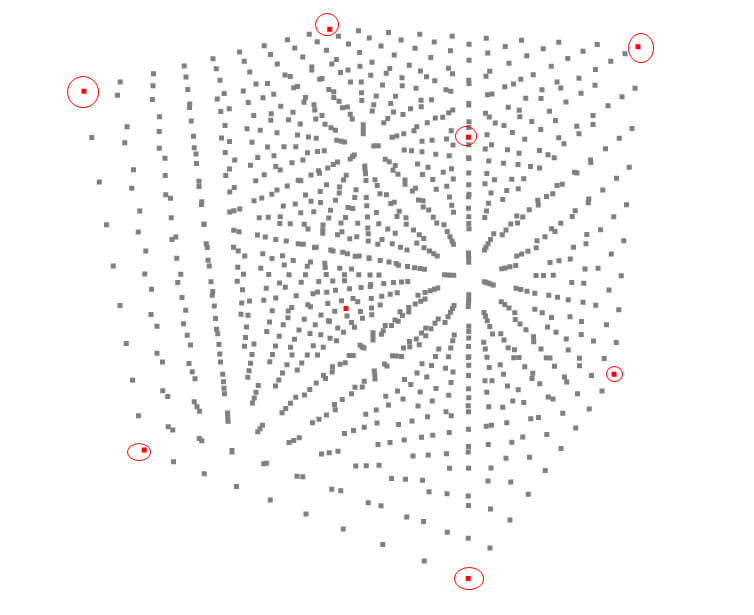
最后来看下如何对立方体点云的8个顶点进行可视化:
import copy
import numpy as np
import open3d as o3d

def create_cube_point_cloud(center=(0,0,0), side_length=1.0, points_per_edge=10):
    # 生成正方体顶点坐标
    half_len = side_length / 2
    x = np.linspace(center[0]-half_len, center[0]+half_len, points_per_edge)
    y = np.linspace(center[1]-half_len, center[1]+half_len, points_per_edge)
    z = np.linspace(center[2]-half_len, center[2]+half_len, points_per_edge)
    xx, yy, zz = np.meshgrid(x, y, z)
    points = np.vstack([xx.ravel(), yy.ravel(), zz.ravel()]).T

    # 创建点云对象
    pcd = o3d.geometry.PointCloud()
    pcd.points = o3d.utility.Vector3dVector(points)
    return pcd

def extract_cube_vertices(points):
    """提取立方体点云的8个顶点"""
    min_coords = np.min(points, axis=0)
    max_coords = np.max(points, axis=0)
    # 组合所有极值点坐标
    vertices = np.array([
        [min_coords[0], min_coords[1], min_coords[2]],
        [min_coords[0], min_coords[1], max_coords[2]],
        [min_coords[0], max_coords[1], min_coords[2]],
        [min_coords[0], max_coords[1], max_coords[2]],
        [max_coords[0], min_coords[1], min_coords[2]],
        [max_coords[0], min_coords[1], max_coords[2]],
        [max_coords[0], max_coords[1], min_coords[2]],
        [max_coords[0], max_coords[1], max_coords[2]]
    ])
    # 将Numpy转换为点云数据
    vertex_cloud = o3d.geometry.PointCloud()
    vertex_cloud.points = o3d.utility.Vector3dVector(vertices)
    return vertex_cloud

def visualize_keypoints(pcd, keypoints):
    """可视化点云和关键点"""
    # 创建点云的副本并为关键点设置颜色
    pcd_copy = copy.deepcopy(pcd)
    pcd_copy.paint_uniform_color([0.5, 0.5, 0.5])  # 原始点云设为灰色

    # 创建关键点的点云并设置为红色
    keypoints_pcd = o3d.geometry.PointCloud()
    keypoints_pcd.points = keypoints.points
    keypoints_pcd.paint_uniform_color([1.0, 0.0, 0.0])  # 关键点设为红色
    # 可视化
    o3d.visualization.draw_geometries([pcd_copy, keypoints_pcd])

def main():
    # 生成立方体点云
    pcd = create_cube_point_cloud()
    keypoints = extract_cube_vertices(pcd.points)

    # 可视化结果
    visualize_keypoints(pcd, keypoints)
这里由于给定的是规则立方体点云,我们通过几何极值的方式对顶点进行提取,通过计算点云在X,Y,Z三个轴上最大值和最小值的组合。其实整个过程还是比较好理解的,我们通过np.min和np.max得到这1000个点中最小点和最大点的坐标。
其结果如下图所示:
如果喜欢这篇文章或对您有帮助,可以:[☕] 请我喝杯咖啡 | [💓] 小额赞助